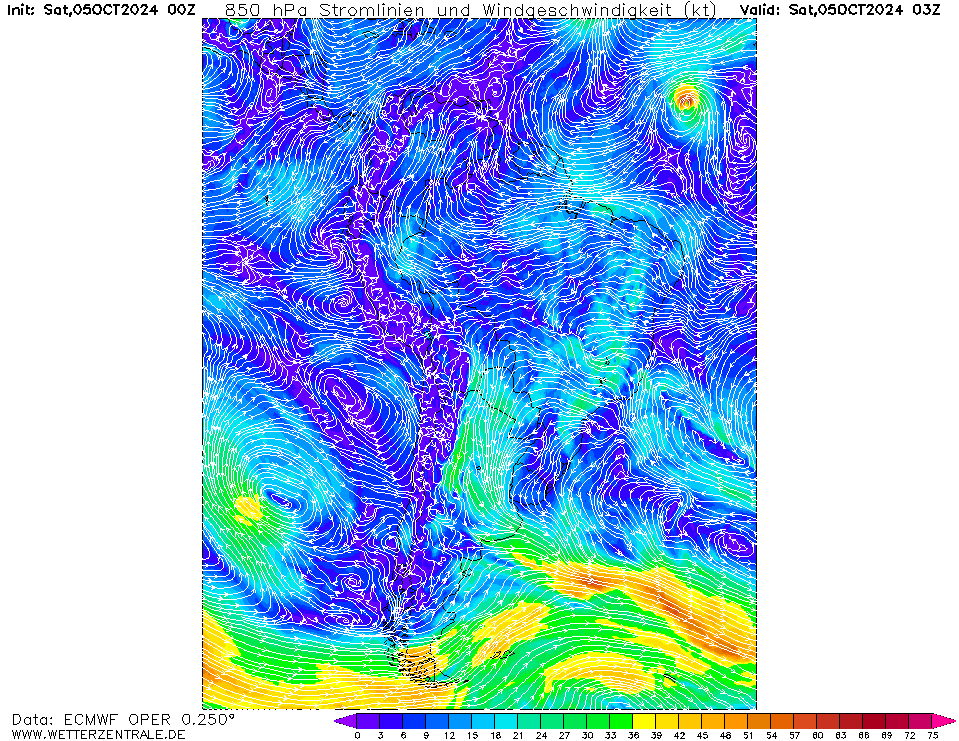
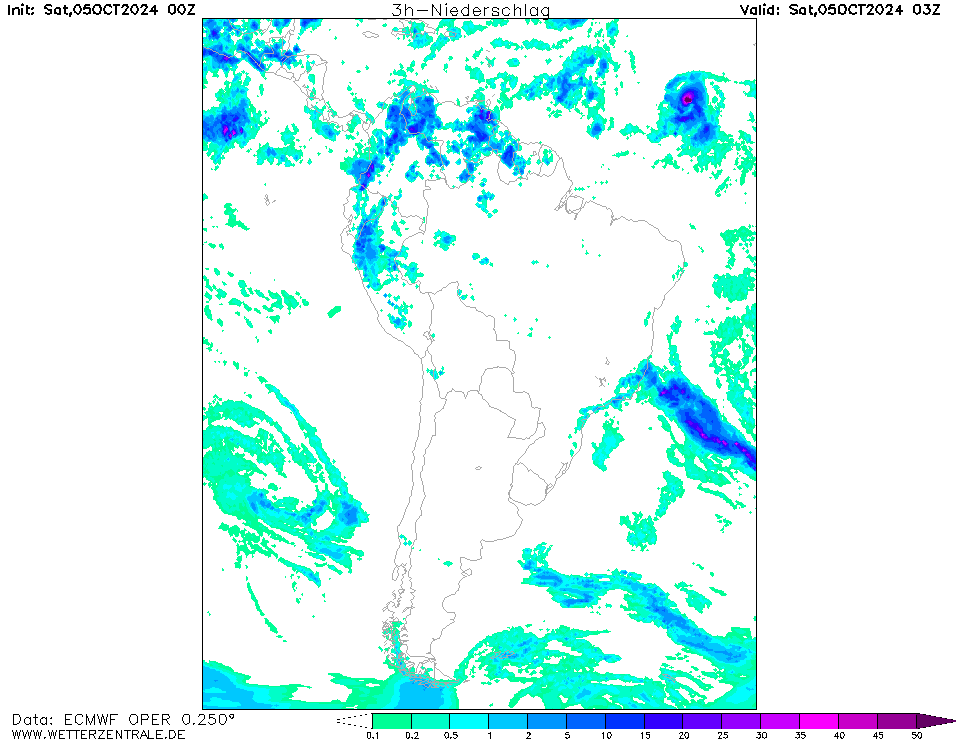
ECMWFCurrently selected. The European Centre for Medium-Range Weather Forecasts (ECMWF) creates forecasts for the upcoming 15 days and is a global leader in forecast skill. However, it offers only a small number of parameters for free. The 00Z and 12Z runs are coming in twice daily between 6 and 7 UTC and 18 and 19 UTC.
GEMThe selected time, variable and region is available for this model. GEM is the global forecast model of the Canadian weather service and computes 10 day forecasts.
GFSThe selected time, variable and region is available for this model. GFS is the global weather forecast model of the US weather service run at an internal resolution of 28 km. It offers a plethora of parameters for the next 15 days. Updated 4 times a day up to 384 hours ahead. The runs for the 0, 6, 12 and 18Z runs are usually coming in from 3:30, 9:30, 15:30 and 21:30 UTC, respectively.
GCGFSThe selected variable and region is available, but not for 2024-08-29, 18:00. You will switch back to the first available time step. The GraphCast Global Forecast System (GraphCastGFS) is an experimental system set up by the National Centers for Environmental Prediction (NCEP) to produce medium range global forecasts. The horizontal resolution is a 0.25 degree latitude-longitude grid (about 28 km). The model runs 4 times a day at 00Z, 06Z, 12Z and 18Z cycles. The products are 6 hourly forecasts up to 10 days. See more info here.


3Thu 22 Aug 03:00
6Thu 22 Aug 06:00
9Thu 22 Aug 09:00
12Thu 22 Aug 12:00
15Thu 22 Aug 15:00
18Thu 22 Aug 18:00
21Thu 22 Aug 21:00
24Fri 23 Aug 00:00
27Fri 23 Aug 03:00
30Fri 23 Aug 06:00
33Fri 23 Aug 09:00
36Fri 23 Aug 12:00
39Fri 23 Aug 15:00
42Fri 23 Aug 18:00
45Fri 23 Aug 21:00
48Sat 24 Aug 00:00
51Sat 24 Aug 03:00
54Sat 24 Aug 06:00
57Sat 24 Aug 09:00
60Sat 24 Aug 12:00
72Sun 25 Aug 00:00
96Mon 26 Aug 00:00
120Tue 27 Aug 00:00
144Wed 28 Aug 00:00
168Thu 29 Aug 00:00
192Fri 30 Aug 00:00
216Sat 31 Aug 00:00
240Sun 01 Sep 00:00
help
Download GIF
hover
Single-variable mode
You are now in the multi variable mode. Select all the variables of interest and they will be plotted side-by-side in a grid.
You are now in the multi variable mode. Select all the variables of interest and they will be plotted side-by-side in a grid.
URL of this map