ALAROThe selected time, variable and region is available for this model.
AROMEThe selected variable and region is available, but not for 2024-08-26, 18:00. You will switch back to the first available time step. AROME is a high resolution (2.5 km) weather forecast model which is used by various weather services in Europe. On the WZ, forecasts from Meteo France and the Norwegian Weather Service are shown for western Europe and northern Europe, respectively.
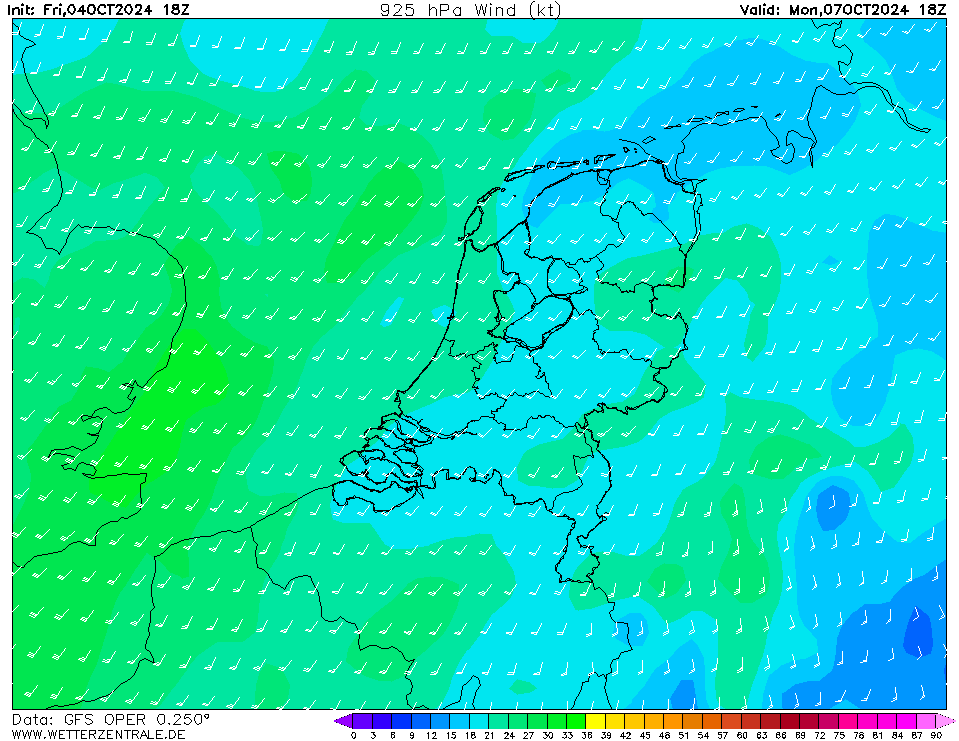
GFSCurrently selected. GFS is the global weather forecast model of the US weather service run at an internal resolution of 28 km. It offers a plethora of parameters for the next 15 days. Updated 4 times a day up to 384 hours ahead. The runs for the 0, 6, 12 and 18Z runs are usually coming in from 3:30, 9:30, 15:30 and 21:30 UTC, respectively.
IRIEThe selected time, variable and region is available for this model.
WRFThe selected time, variable and region is available for this model. WRF (Weather Research and Forecasting model) is a freely available weather forecast model. WRF version 3.9 is run on the WZ servers and offers 4 forecasts per day up to 72 hours. It is currently run with a horizontal grid spacing of 5 km and uses the WRF single-moment 3 class microphysics scheme, the YSU PBL scheme and the Dudhia radiation scheme.


0Fri 23 Aug 18:00
12Sat 24 Aug 06:00
24Sat 24 Aug 18:00
36Sun 25 Aug 06:00
48Sun 25 Aug 18:00
60Mon 26 Aug 06:00
72Mon 26 Aug 18:00
84Tue 27 Aug 06:00
96Tue 27 Aug 18:00
108Wed 28 Aug 06:00
120Wed 28 Aug 18:00
132Thu 29 Aug 06:00
144Thu 29 Aug 18:00
156Fri 30 Aug 06:00
168Fri 30 Aug 18:00
180Sat 31 Aug 06:00
192Sat 31 Aug 18:00
204Sun 01 Sep 06:00
216Sun 01 Sep 18:00
228Mon 02 Sep 06:00
240Mon 02 Sep 18:00
252Tue 03 Sep 06:00
264Tue 03 Sep 18:00
276Wed 04 Sep 06:00
288Wed 04 Sep 18:00
300Thu 05 Sep 06:00
312Thu 05 Sep 18:00
324Fri 06 Sep 06:00
336Fri 06 Sep 18:00
348Sat 07 Sep 06:00
360Sat 07 Sep 18:00
372Sun 08 Sep 06:00
384Sun 08 Sep 18:00
help
Download GIF
hover
Single-variable mode
You are now in the multi variable mode. Select all the variables of interest and they will be plotted side-by-side in a grid.
You are now in the multi variable mode. Select all the variables of interest and they will be plotted side-by-side in a grid.
URL of this map