GEMThe selected time, variable and region is available for this model. GEM is the global forecast model of the Canadian weather service and computes 10 day forecasts.
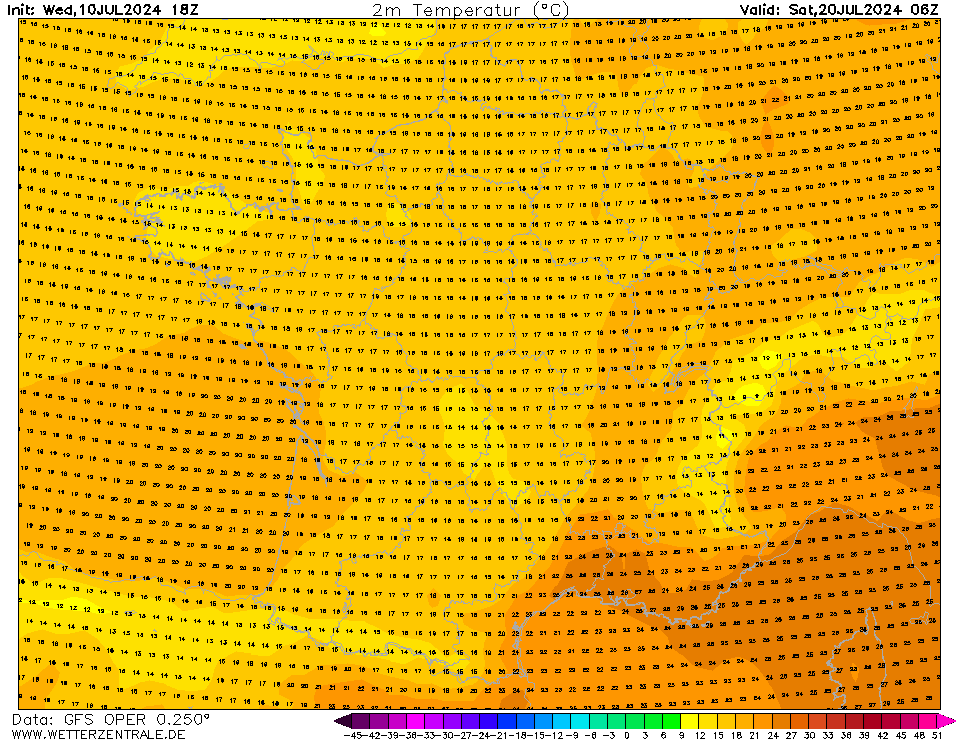
GFSCurrently selected. GFS is the global weather forecast model of the US weather service run at an internal resolution of 28 km. It offers a plethora of parameters for the next 15 days. Updated 4 times a day up to 384 hours ahead. The runs for the 0, 6, 12 and 18Z runs are usually coming in from 3:30, 9:30, 15:30 and 21:30 UTC, respectively.
HARMONIE (KNMI-EU)The selected variable and region is available, but not for 2024-09-04, 06:00. You will switch back to the first available time step. HARMONIE is developed in a european consortium and this is the output provided by the KNMI at the supercomputing facilities in Iceland. The output from Cy43 is available at a rotated lat-lon grid and regridded at our server to a grid spacing of 0.05 degree. These data are the raw data provided by the KNMI. The model is reinitialized every hour and run up to 60 hrs ahead.
HARMONIE (DMI)The selected variable and region is available, but not for 2024-09-04, 06:00. You will switch back to the first available time step.
ICONThe selected variable and region is available, but not for 2024-09-04, 06:00. You will switch back to the first available time step. ICON is the global weather forecast of the German weather service (DWD) with a grid spacing of approx. 13 km globally (Europe nest: 6 km). Model output is available up to 180 hours ahead for the 0Z and 12Z runs, and up to 120 hours for the 6Z and 18Z runs.
UKMO EUThe selected variable and region is available, but not for 2024-09-04, 06:00. You will switch back to the first available time step.


6Mon 26 Aug 00:00
12Mon 26 Aug 06:00
18Mon 26 Aug 12:00
24Mon 26 Aug 18:00
30Tue 27 Aug 00:00
36Tue 27 Aug 06:00
42Tue 27 Aug 12:00
48Tue 27 Aug 18:00
54Wed 28 Aug 00:00
60Wed 28 Aug 06:00
66Wed 28 Aug 12:00
72Wed 28 Aug 18:00
78Thu 29 Aug 00:00
84Thu 29 Aug 06:00
90Thu 29 Aug 12:00
96Thu 29 Aug 18:00
102Fri 30 Aug 00:00
108Fri 30 Aug 06:00
114Fri 30 Aug 12:00
120Fri 30 Aug 18:00
126Sat 31 Aug 00:00
132Sat 31 Aug 06:00
138Sat 31 Aug 12:00
144Sat 31 Aug 18:00
150Sun 01 Sep 00:00
156Sun 01 Sep 06:00
162Sun 01 Sep 12:00
168Sun 01 Sep 18:00
174Mon 02 Sep 00:00
180Mon 02 Sep 06:00
186Mon 02 Sep 12:00
192Mon 02 Sep 18:00
198Tue 03 Sep 00:00
204Tue 03 Sep 06:00
210Tue 03 Sep 12:00
216Tue 03 Sep 18:00
222Wed 04 Sep 00:00
228Wed 04 Sep 06:00
234Wed 04 Sep 12:00
240Wed 04 Sep 18:00
246Thu 05 Sep 00:00
252Thu 05 Sep 06:00
258Thu 05 Sep 12:00
264Thu 05 Sep 18:00
270Fri 06 Sep 00:00
276Fri 06 Sep 06:00
282Fri 06 Sep 12:00
288Fri 06 Sep 18:00
294Sat 07 Sep 00:00
300Sat 07 Sep 06:00
306Sat 07 Sep 12:00
312Sat 07 Sep 18:00
318Sun 08 Sep 00:00
324Sun 08 Sep 06:00
330Sun 08 Sep 12:00
336Sun 08 Sep 18:00
342Mon 09 Sep 00:00
348Mon 09 Sep 06:00
354Mon 09 Sep 12:00
360Mon 09 Sep 18:00
366Tue 10 Sep 00:00

help
Download GIF
hover
Single-variable mode
You are now in the multi variable mode. Select all the variables of interest and they will be plotted side-by-side in a grid.
You are now in the multi variable mode. Select all the variables of interest and they will be plotted side-by-side in a grid.
URL of this map