AROMEThe selected time, variable and region is available for this model. AROME is a high resolution (2.5 km) weather forecast model which is used by various weather services in Europe. On the WZ, forecasts from Meteo France and the Norwegian Weather Service are shown for western Europe and northern Europe, respectively.
ARPEGEThe selected time, variable and region is available for this model. ARPEGE is the global forecast model of the French weather service (Meteo France). It is runs with a maximum resolution of approx. 7 km in Europe and mean global grid spacing of 15 km. WZ offers forecasts up to 102 hours.
GFSThe selected time, variable and region is available for this model. GFS is the global weather forecast model of the US weather service run at an internal resolution of 28 km. It offers a plethora of parameters for the next 15 days. Updated 4 times a day up to 384 hours ahead. The runs for the 0, 6, 12 and 18Z runs are usually coming in from 3:30, 9:30, 15:30 and 21:30 UTC, respectively.
HARMONIE (KNMI-EU)The selected time, variable and region is available for this model. HARMONIE is developed in a european consortium and this is the output provided by the KNMI at the supercomputing facilities in Iceland. The output from Cy43 is available at a rotated lat-lon grid and regridded at our server to a grid spacing of 0.05 degree. These data are the raw data provided by the KNMI. The model is reinitialized every hour and run up to 60 hrs ahead.
HARMONIE (DMI)The selected time, variable and region is available for this model.
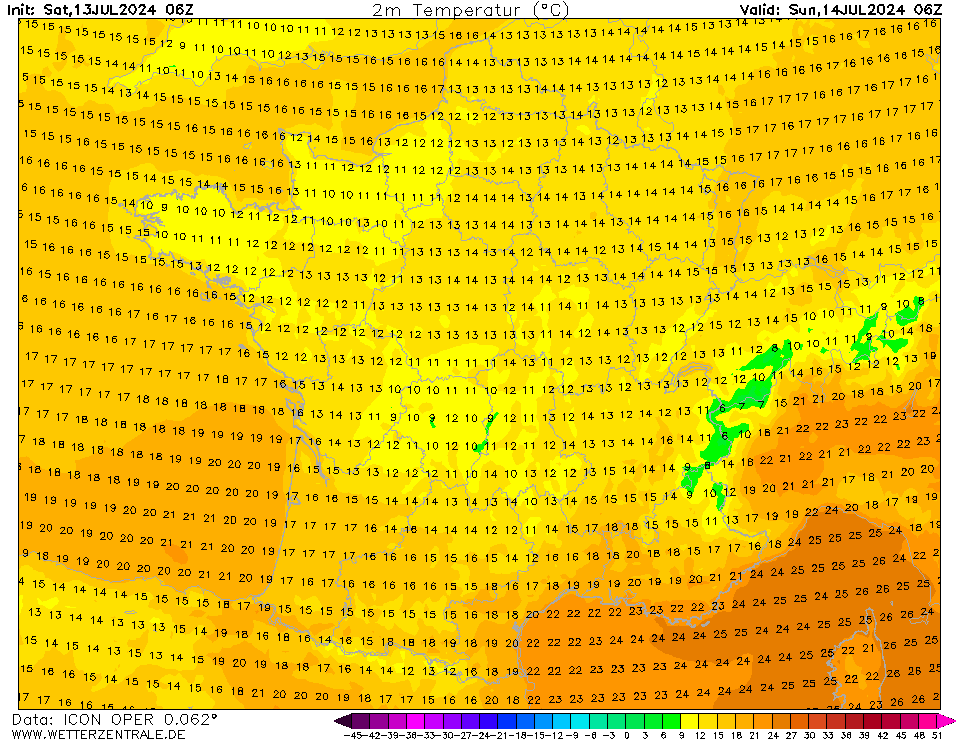
ICONCurrently selected. ICON is the global weather forecast of the German weather service (DWD) with a grid spacing of approx. 13 km globally (Europe nest: 6 km). Model output is available up to 180 hours ahead for the 0Z and 12Z runs, and up to 120 hours for the 6Z and 18Z runs.
IRIEThe selected time, variable and region is available for this model.
UKMO EUThe selected time, variable and region is available for this model.


0Wed 21 Aug 06:00
3Wed 21 Aug 09:00
6Wed 21 Aug 12:00
9Wed 21 Aug 15:00
12Wed 21 Aug 18:00
15Wed 21 Aug 21:00
18Thu 22 Aug 00:00
21Thu 22 Aug 03:00
24Thu 22 Aug 06:00
27Thu 22 Aug 09:00
30Thu 22 Aug 12:00
33Thu 22 Aug 15:00
36Thu 22 Aug 18:00
39Thu 22 Aug 21:00
42Fri 23 Aug 00:00
45Fri 23 Aug 03:00
48Fri 23 Aug 06:00
51Fri 23 Aug 09:00
54Fri 23 Aug 12:00
57Fri 23 Aug 15:00
60Fri 23 Aug 18:00
63Fri 23 Aug 21:00
66Sat 24 Aug 00:00
69Sat 24 Aug 03:00
72Sat 24 Aug 06:00
75Sat 24 Aug 09:00
78Sat 24 Aug 12:00
81Sat 24 Aug 15:00
84Sat 24 Aug 18:00
87Sat 24 Aug 21:00
90Sun 25 Aug 00:00
93Sun 25 Aug 03:00
96Sun 25 Aug 06:00
99Sun 25 Aug 09:00
102Sun 25 Aug 12:00
105Sun 25 Aug 15:00
108Sun 25 Aug 18:00
111Sun 25 Aug 21:00
114Mon 26 Aug 00:00
117Mon 26 Aug 03:00
120Mon 26 Aug 06:00

help
Download GIF
hover
Single-variable mode
You are now in the multi variable mode. Select all the variables of interest and they will be plotted side-by-side in a grid.
You are now in the multi variable mode. Select all the variables of interest and they will be plotted side-by-side in a grid.
URL of this map