AROMEThe selected time, variable and region is available for this model. AROME is a high resolution (2.5 km) weather forecast model which is used by various weather services in Europe. On the WZ, forecasts from Meteo France and the Norwegian Weather Service are shown for western Europe and northern Europe, respectively.
ARPEGEThe selected variable and region is available, but not for 2024-08-15, 20:00. You will switch back to the first available time step. ARPEGE is the global forecast model of the French weather service (Meteo France). It is runs with a maximum resolution of approx. 7 km in Europe and mean global grid spacing of 15 km. WZ offers forecasts up to 102 hours.
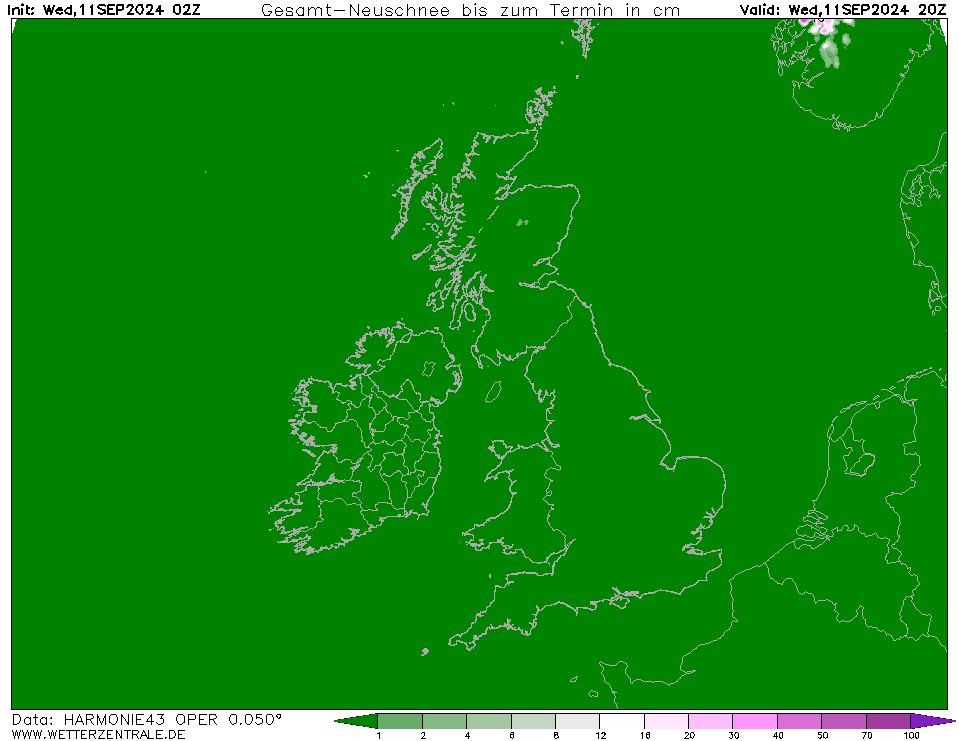
HARMONIE (KNMI-EU)Currently selected. HARMONIE is developed in a european consortium and this is the output provided by the KNMI at the supercomputing facilities in Iceland. The output from Cy43 is available at a rotated lat-lon grid and regridded at our server to a grid spacing of 0.05 degree. These data are the raw data provided by the KNMI. The model is reinitialized every hour and run up to 60 hrs ahead.
HARMONIE (DMI)The selected time, variable and region is available for this model.
UKMO EUThe selected variable and region is available, but not for 2024-08-15, 20:00. You will switch back to the first available time step.


Member:
OP 1Thu 15 Aug 03:00
2Thu 15 Aug 04:00
3Thu 15 Aug 05:00
4Thu 15 Aug 06:00
5Thu 15 Aug 07:00
6Thu 15 Aug 08:00
7Thu 15 Aug 09:00
8Thu 15 Aug 10:00
9Thu 15 Aug 11:00
10Thu 15 Aug 12:00
11Thu 15 Aug 13:00
12Thu 15 Aug 14:00
13Thu 15 Aug 15:00
14Thu 15 Aug 16:00
15Thu 15 Aug 17:00
16Thu 15 Aug 18:00
17Thu 15 Aug 19:00
18Thu 15 Aug 20:00
19Thu 15 Aug 21:00
20Thu 15 Aug 22:00
21Thu 15 Aug 23:00
22Fri 16 Aug 00:00
23Fri 16 Aug 01:00
24Fri 16 Aug 02:00
25Fri 16 Aug 03:00
26Fri 16 Aug 04:00
27Fri 16 Aug 05:00
28Fri 16 Aug 06:00
29Fri 16 Aug 07:00
30Fri 16 Aug 08:00
31Fri 16 Aug 09:00
32Fri 16 Aug 10:00
33Fri 16 Aug 11:00
34Fri 16 Aug 12:00
help
Download GIF
hover
Single-variable mode
You are now in the multi variable mode. Select all the variables of interest and they will be plotted side-by-side in a grid.
You are now in the multi variable mode. Select all the variables of interest and they will be plotted side-by-side in a grid.
URL of this map