AROMEThe selected variable and region is available, but not for 2024-07-15, 12:00. You will switch back to the first available time step. AROME is a high resolution (2.5 km) weather forecast model which is used by various weather services in Europe. On the WZ, forecasts from Meteo France and the Norwegian Weather Service are shown for western Europe and northern Europe, respectively.
HARMONIE (DMI)The selected variable and region is available, but not for 2024-07-15, 12:00. You will switch back to the first available time step.
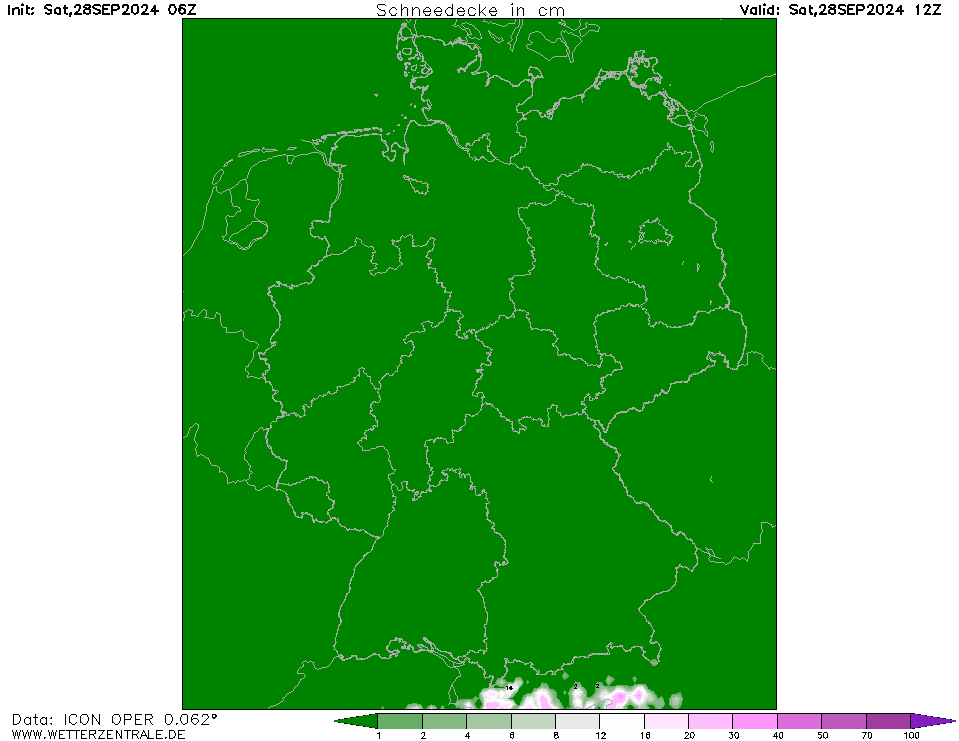
ICONCurrently selected. ICON is the global weather forecast of the German weather service (DWD) with a grid spacing of approx. 13 km globally (Europe nest: 6 km). Model output is available up to 180 hours ahead for the 0Z and 12Z runs, and up to 120 hours for the 6Z and 18Z runs.
WRFThe selected time, variable and region is available for this model. WRF (Weather Research and Forecasting model) is a freely available weather forecast model. WRF version 3.9 is run on the WZ servers and offers 4 forecasts per day up to 72 hours. It is currently run with a horizontal grid spacing of 5 km and uses the WRF single-moment 3 class microphysics scheme, the YSU PBL scheme and the Dudhia radiation scheme.


3Mon 15 Jul 09:00
6Mon 15 Jul 12:00
9Mon 15 Jul 15:00
12Mon 15 Jul 18:00
15Mon 15 Jul 21:00
18Tue 16 Jul 00:00
21Tue 16 Jul 03:00
24Tue 16 Jul 06:00
27Tue 16 Jul 09:00
30Tue 16 Jul 12:00
33Tue 16 Jul 15:00
36Tue 16 Jul 18:00
39Tue 16 Jul 21:00
42Wed 17 Jul 00:00
45Wed 17 Jul 03:00
48Wed 17 Jul 06:00
51Wed 17 Jul 09:00
54Wed 17 Jul 12:00
57Wed 17 Jul 15:00
60Wed 17 Jul 18:00
63Wed 17 Jul 21:00
66Thu 18 Jul 00:00
69Thu 18 Jul 03:00
72Thu 18 Jul 06:00
75Thu 18 Jul 09:00
78Thu 18 Jul 12:00
81Thu 18 Jul 15:00
84Thu 18 Jul 18:00
87Thu 18 Jul 21:00
90Fri 19 Jul 00:00
93Fri 19 Jul 03:00
96Fri 19 Jul 06:00
99Fri 19 Jul 09:00
102Fri 19 Jul 12:00
105Fri 19 Jul 15:00
108Fri 19 Jul 18:00
111Fri 19 Jul 21:00
114Sat 20 Jul 00:00
117Sat 20 Jul 03:00
120Sat 20 Jul 06:00


help
Download GIF
hover
Single-variable mode
You are now in the multi variable mode. Select all the variables of interest and they will be plotted side-by-side in a grid.
You are now in the multi variable mode. Select all the variables of interest and they will be plotted side-by-side in a grid.
URL of this map