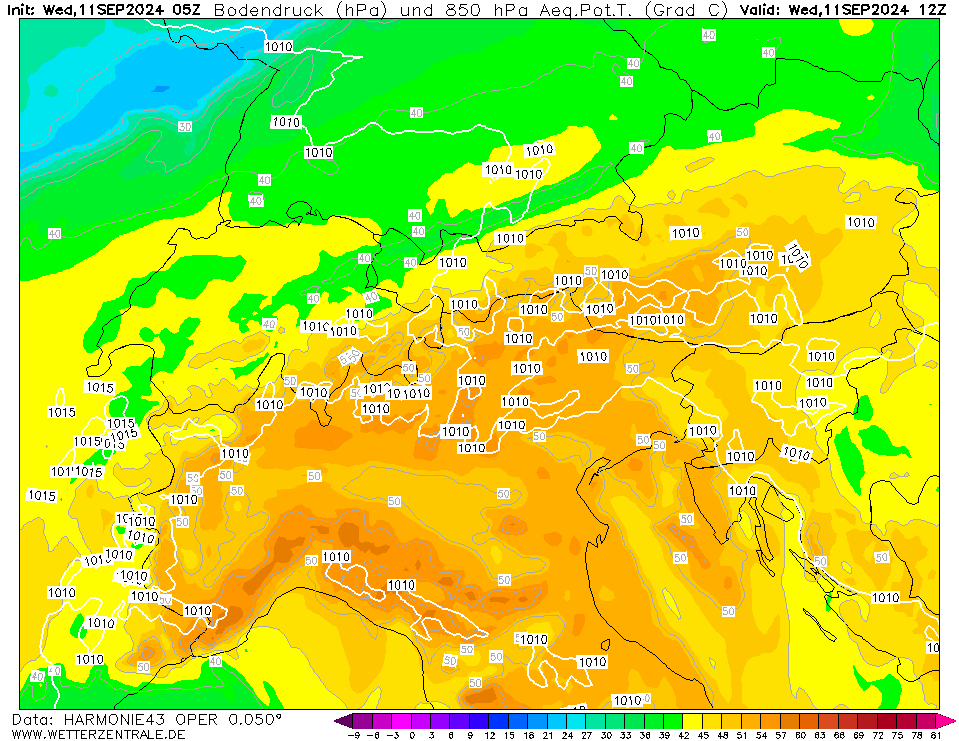
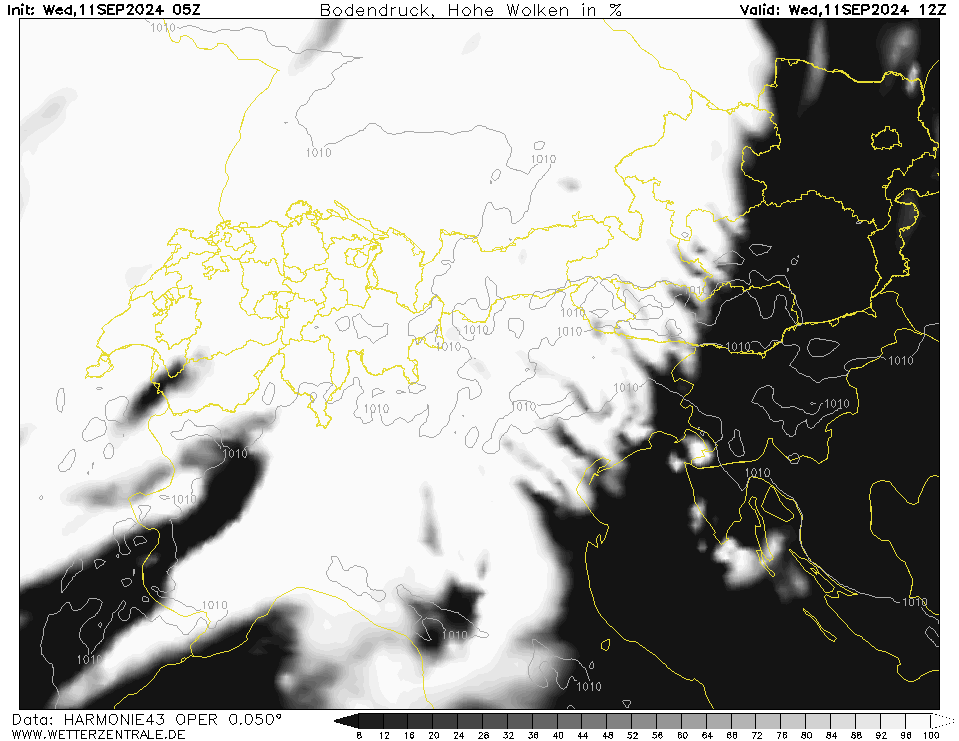
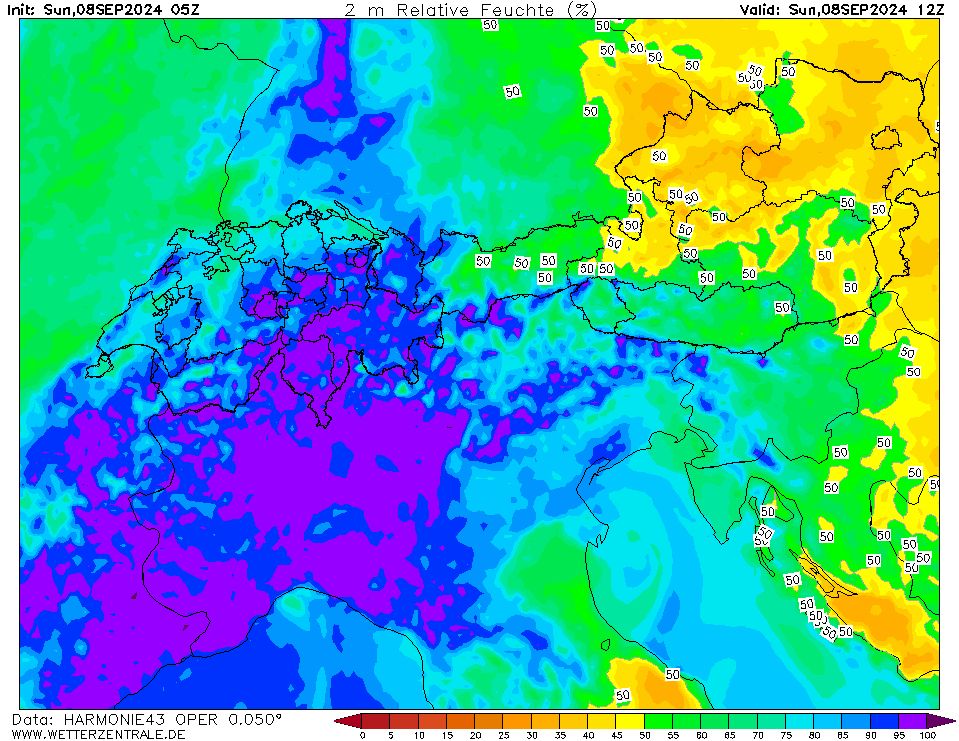
HARMONIE (KNMI-EU)Currently selected. HARMONIE is developed in a european consortium and this is the output provided by the KNMI at the supercomputing facilities in Iceland. The output from Cy43 is available at a rotated lat-lon grid and regridded at our server to a grid spacing of 0.05 degree. These data are the raw data provided by the KNMI. The model is reinitialized every hour and run up to 60 hrs ahead.
WRFThe selected variable and region is available, but not for 2024-08-18, 12:00. You will switch back to the first available time step. WRF (Weather Research and Forecasting model) is a freely available weather forecast model. WRF version 3.9 is run on the WZ servers and offers 4 forecasts per day up to 72 hours. It is currently run with a horizontal grid spacing of 5 km and uses the WRF single-moment 3 class microphysics scheme, the YSU PBL scheme and the Dudhia radiation scheme.


Member:
OP 0Sun 18 Aug 05:00
1Sun 18 Aug 06:00
2Sun 18 Aug 07:00
3Sun 18 Aug 08:00
4Sun 18 Aug 09:00
5Sun 18 Aug 10:00
6Sun 18 Aug 11:00
7Sun 18 Aug 12:00
8Sun 18 Aug 13:00
9Sun 18 Aug 14:00
10Sun 18 Aug 15:00
11Sun 18 Aug 16:00
12Sun 18 Aug 17:00
13Sun 18 Aug 18:00
14Sun 18 Aug 19:00
15Sun 18 Aug 20:00
16Sun 18 Aug 21:00
17Sun 18 Aug 22:00
18Sun 18 Aug 23:00
19Mon 19 Aug 00:00
20Mon 19 Aug 01:00
21Mon 19 Aug 02:00
22Mon 19 Aug 03:00
23Mon 19 Aug 04:00
24Mon 19 Aug 05:00
25Mon 19 Aug 06:00
26Mon 19 Aug 07:00
27Mon 19 Aug 08:00
28Mon 19 Aug 09:00
29Mon 19 Aug 10:00
30Mon 19 Aug 11:00
31Mon 19 Aug 12:00
32Mon 19 Aug 13:00
33Mon 19 Aug 14:00
34Mon 19 Aug 15:00
35Mon 19 Aug 16:00
36Mon 19 Aug 17:00
37Mon 19 Aug 18:00
38Mon 19 Aug 19:00
39Mon 19 Aug 20:00
40Mon 19 Aug 21:00
41Mon 19 Aug 22:00
42Mon 19 Aug 23:00
43Tue 20 Aug 00:00
44Tue 20 Aug 01:00
45Tue 20 Aug 02:00
46Tue 20 Aug 03:00
47Tue 20 Aug 04:00
48Tue 20 Aug 05:00
49Tue 20 Aug 06:00
50Tue 20 Aug 07:00
51Tue 20 Aug 08:00
52Tue 20 Aug 09:00
53Tue 20 Aug 10:00
54Tue 20 Aug 11:00
55Tue 20 Aug 12:00
56Tue 20 Aug 13:00
57Tue 20 Aug 14:00
58Tue 20 Aug 15:00
59Tue 20 Aug 16:00
60Tue 20 Aug 17:00
help
Download GIF
click
Single-variable mode
You are now in the multi variable mode. Select all the variables of interest and they will be plotted side-by-side in a grid.
You are now in the multi variable mode. Select all the variables of interest and they will be plotted side-by-side in a grid.
URL of this map